
Run whk with no arguments, or whk ui, and the CLI opens a full-screen
dashboard in your terminal. You get most of the web dashboard there: sources,
destinations, connections, the event log, the dead-letter queue and stats,
plus a relay that forwards webhooks to localhost. It reads the same saved key as the rest of the CLI,
and if there is none it asks you to log in first.
Moving around
Section titled “Moving around”Navigation borrows from vim and less. Arrow keys work too.
| Key | Action |
|---|---|
j / k, arrows | Move the selection |
enter | Open the selected item |
esc | Go back |
tab | Next pane or tab |
g + letter | Jump to a screen: s sources, d destinations, c connections, e events, q DLQ, t stats, r relay, , settings |
r | Refresh now |
y | Copy the ingest URL, URL or id under the cursor |
? | Show every key for the current screen |
q, ctrl+c | Quit |
The bottom line always lists the keys that apply to the current screen, so you
rarely need ?.
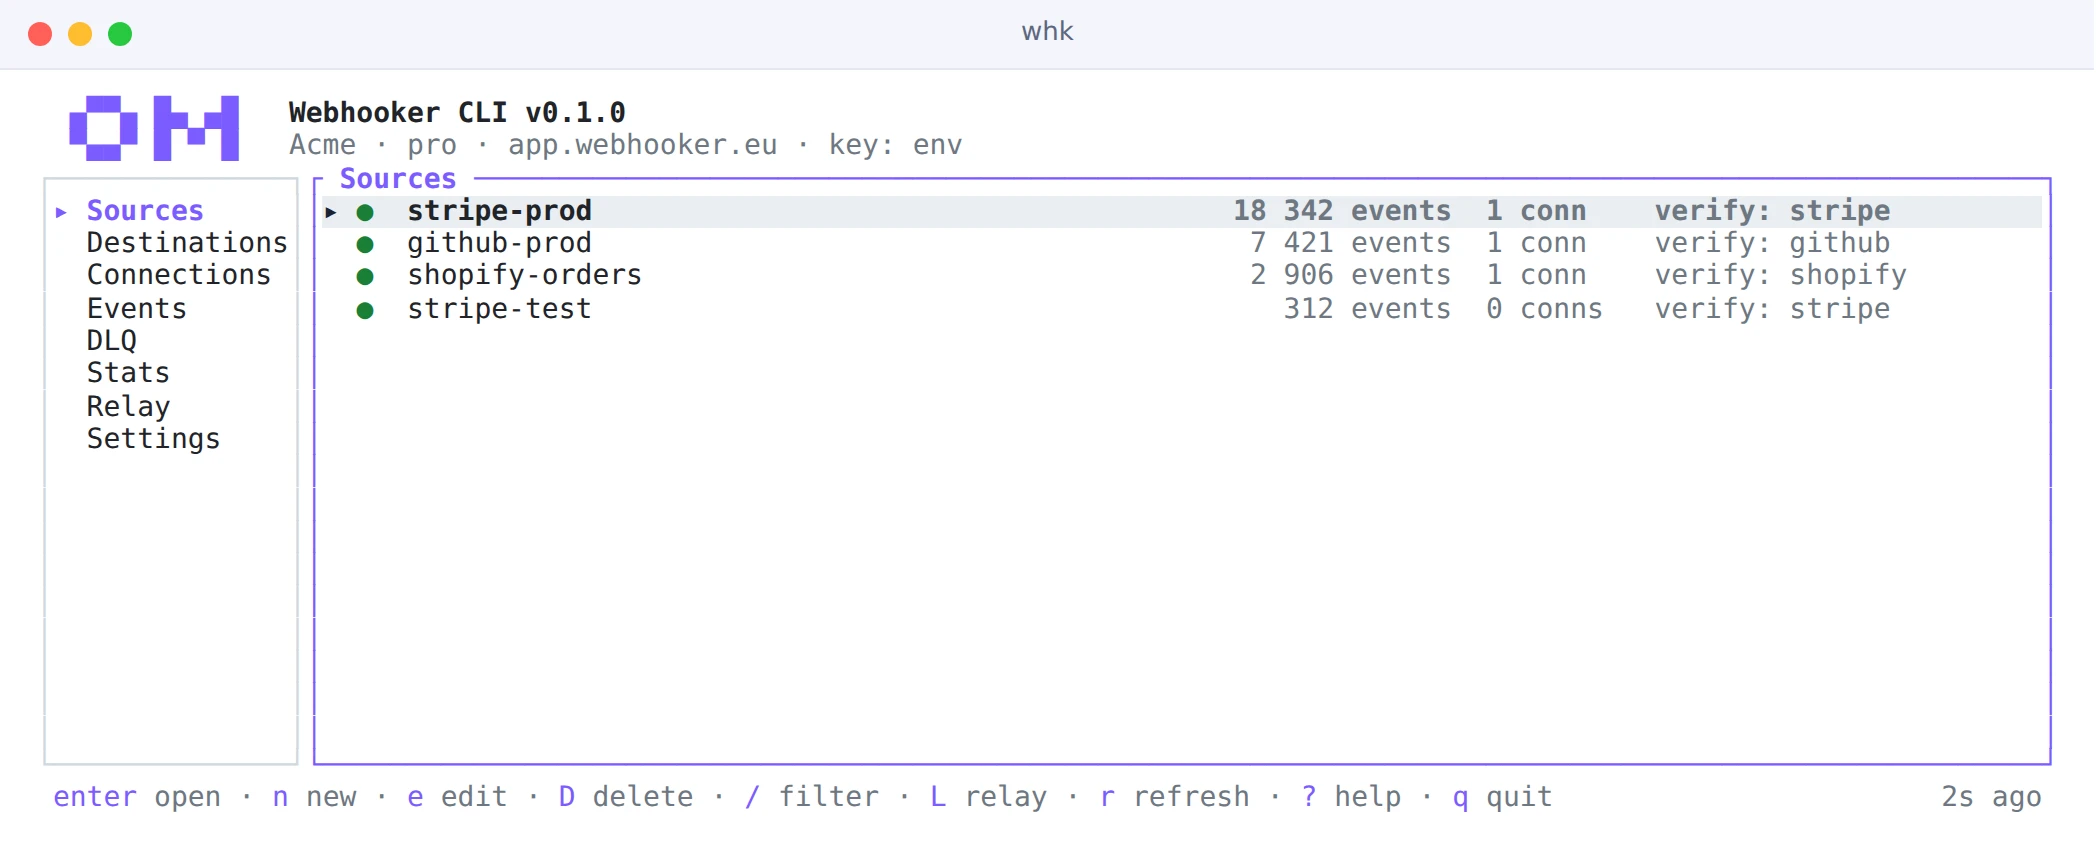
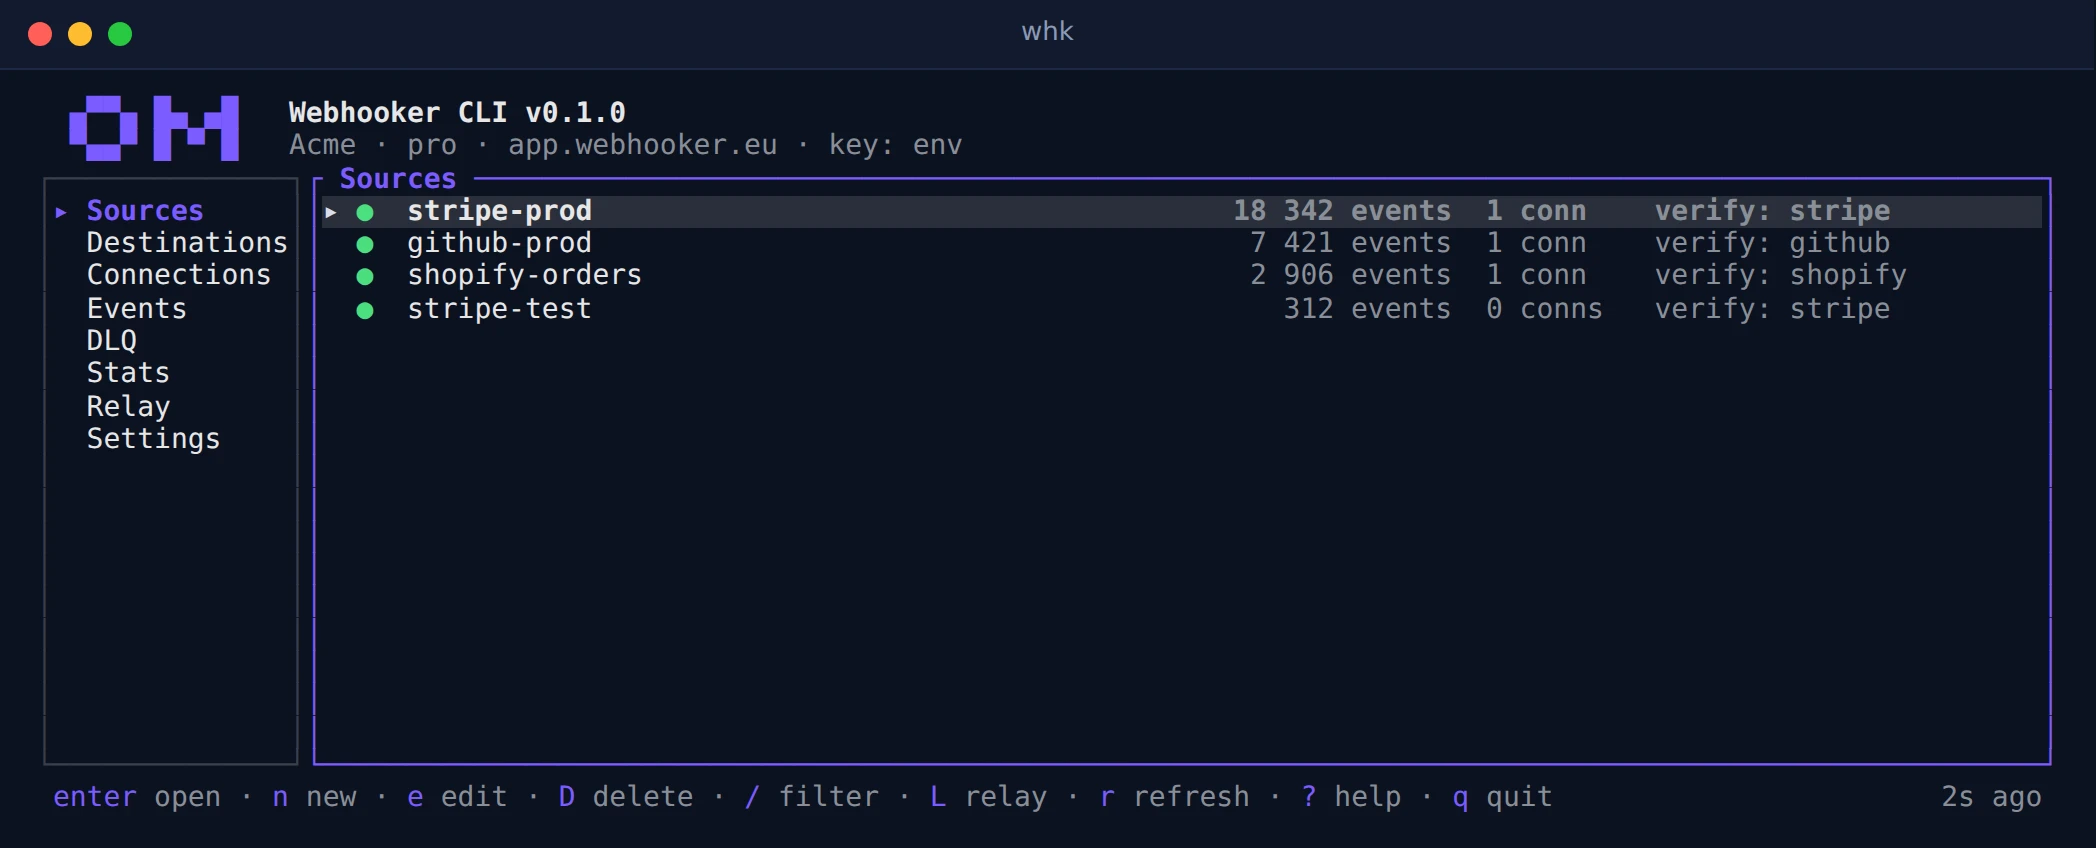
Sources
Section titled “Sources”The list shows each source’s event count, how many connections it has and
which provider it verifies. n creates a source, e edits the selected one,
D deletes it, and / filters the list by name.
Opening a source gives five tabs, switched with 1 to 5:
- Overview: ingest URL, status, verification, response settings and id.
Ppauses the source andTrotates its token. - Live: events as they arrive, like
whk tailinside the UI. - Events: this source’s event log.
- Connections: where this source delivers to.
- DLQ: this source’s dead-lettered deliveries.
Events
Section titled “Events”The events screen lists everything the workspace received, newest first, with
the source, size, signature check and delivery result of each event. F opens
the filters (source, verification status, time window), and [ and ] page
through.
Open an event to see its headers, body and deliveries side by side.
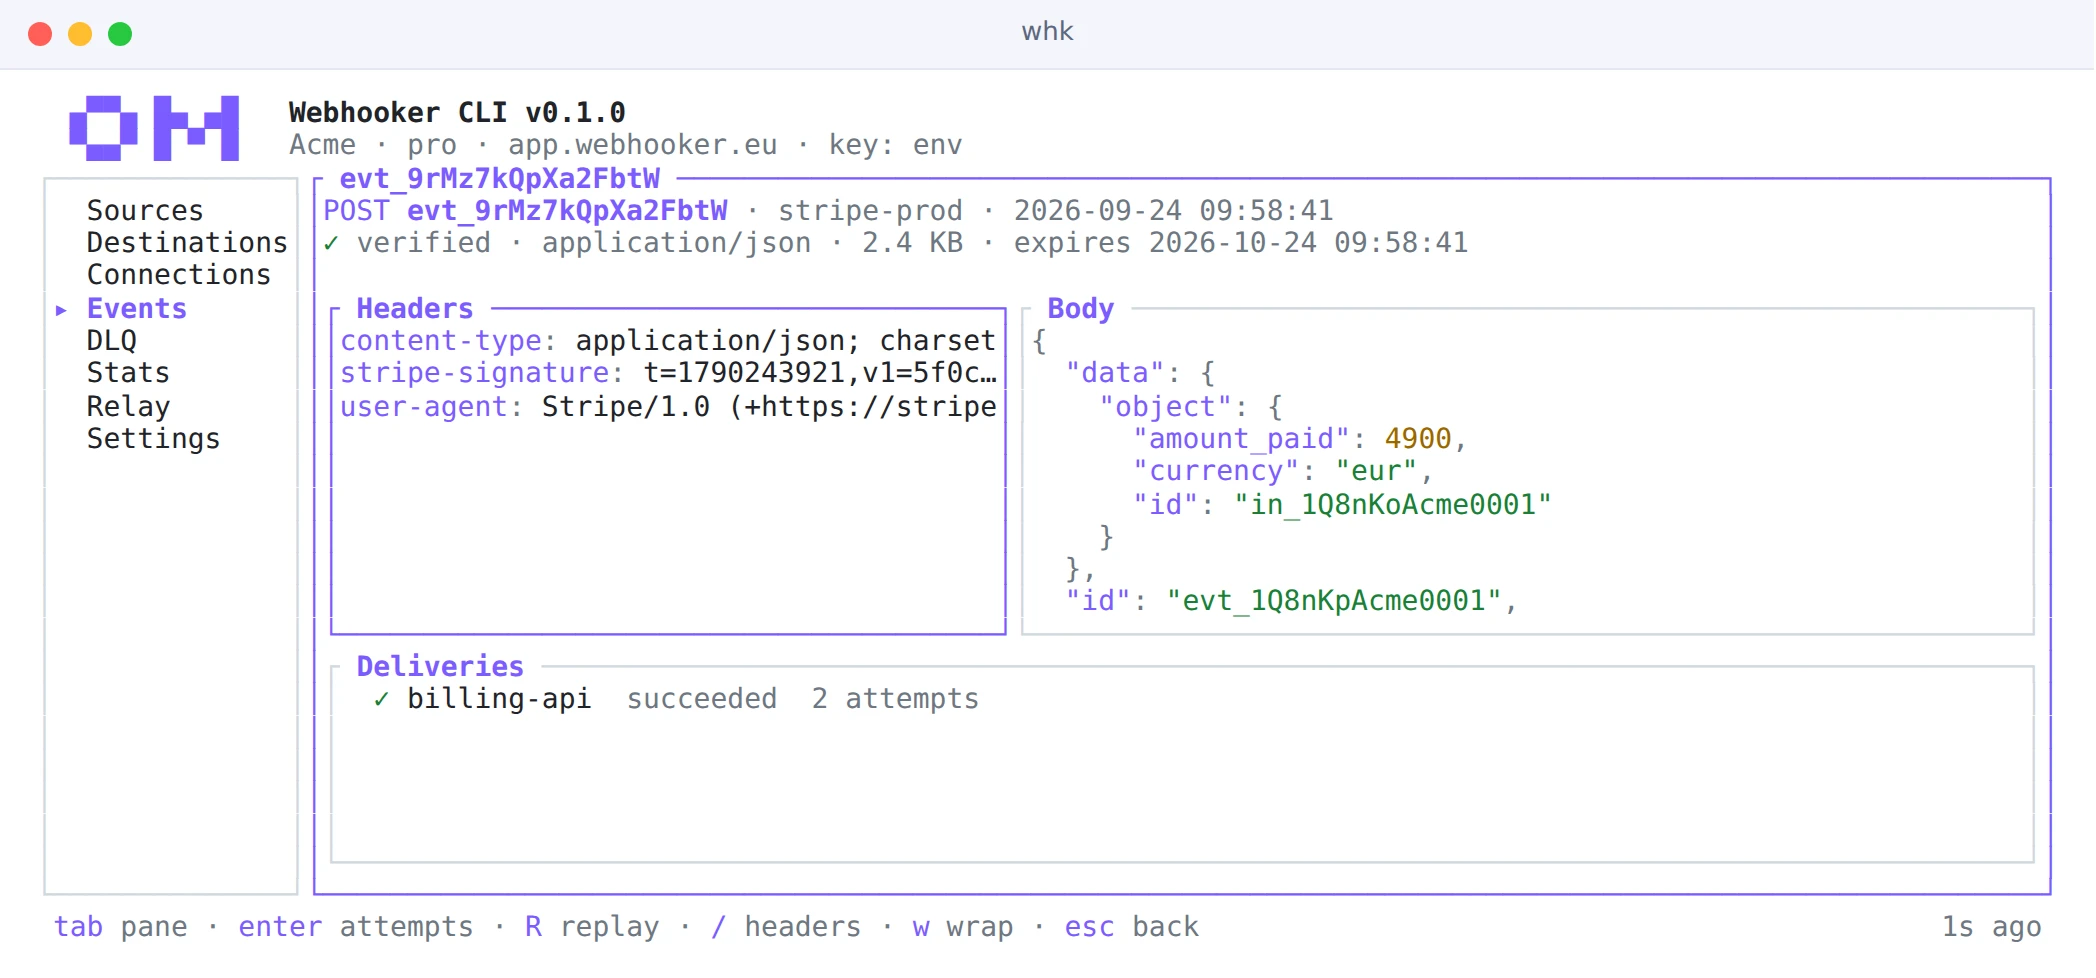
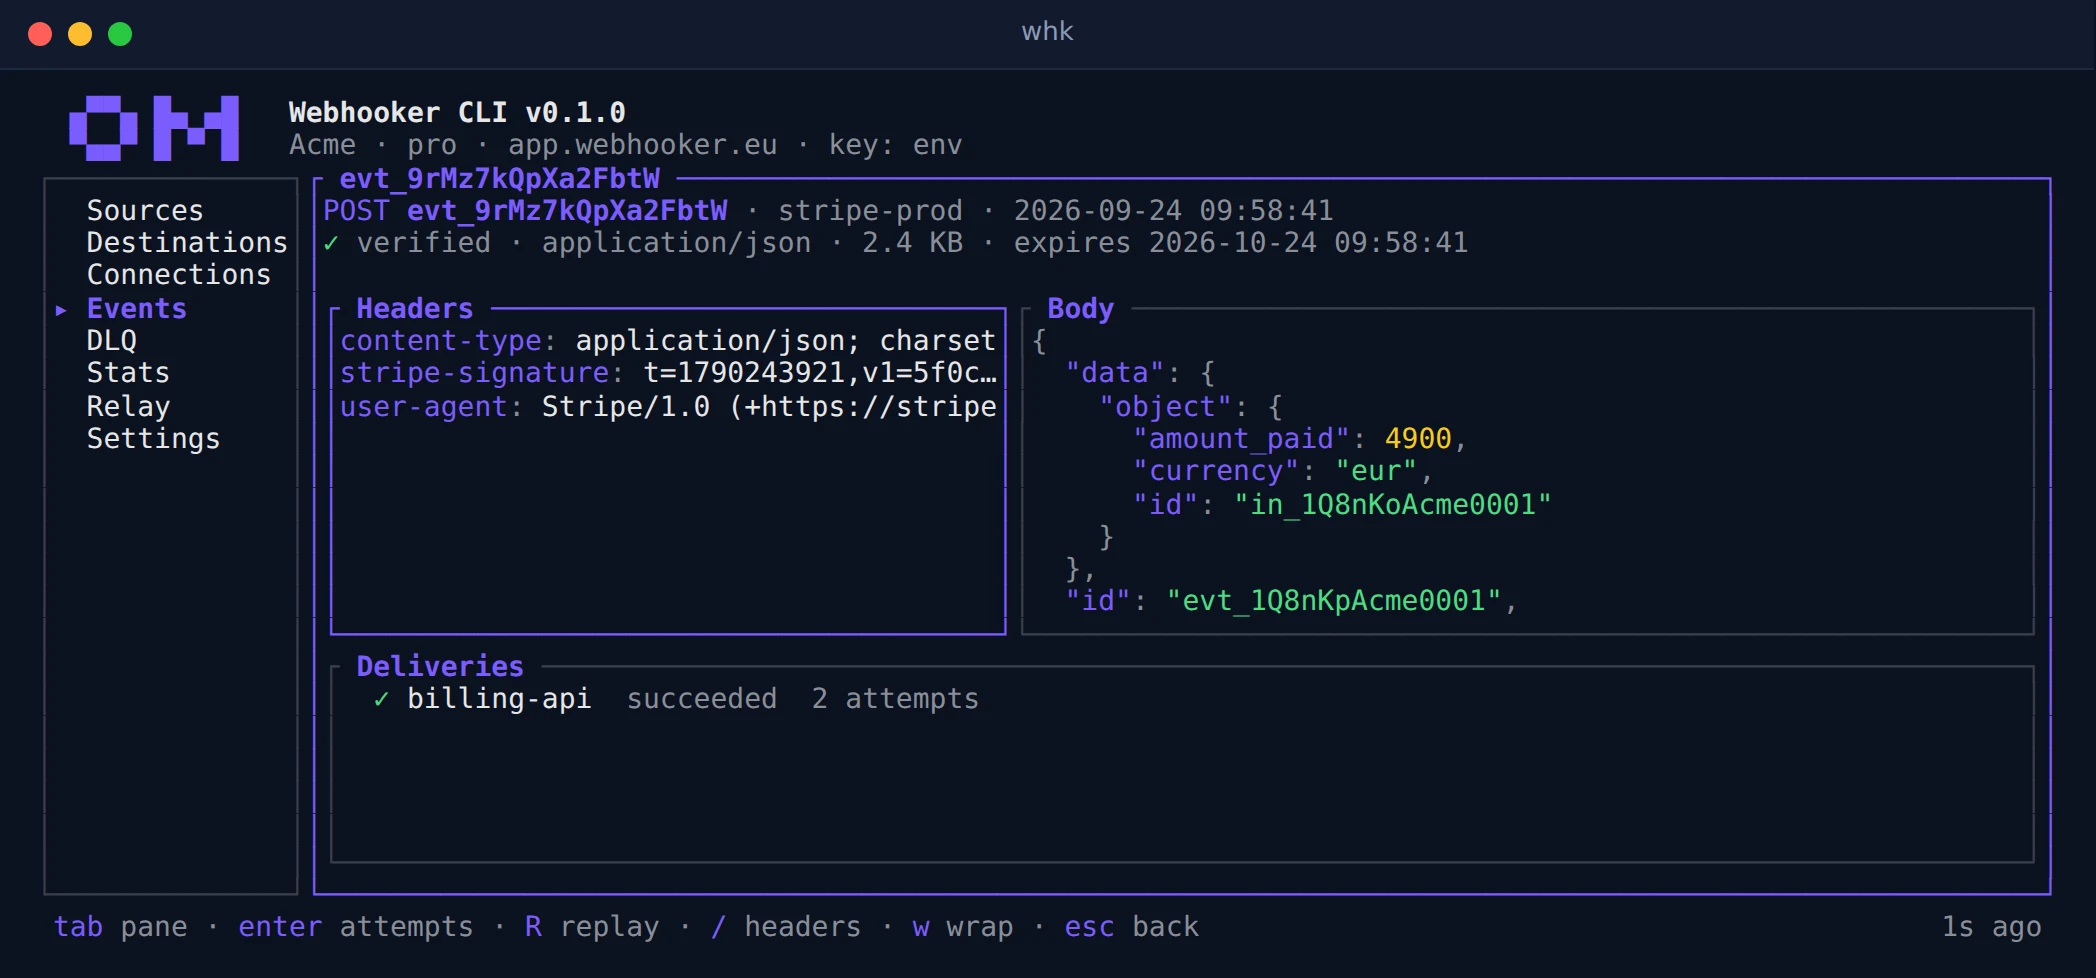
In the detail view, enter on a delivery lists every attempt with its status
code, latency and response body, and R replays the event. w toggles line
wrapping for long bodies.
Relay webhooks to localhost
Section titled “Relay webhooks to localhost”The relay is whk listen with a request inspector. Press L on a source, or
n on the Relay screen, choose the source and the local target URL, and save
with ctrl+s.
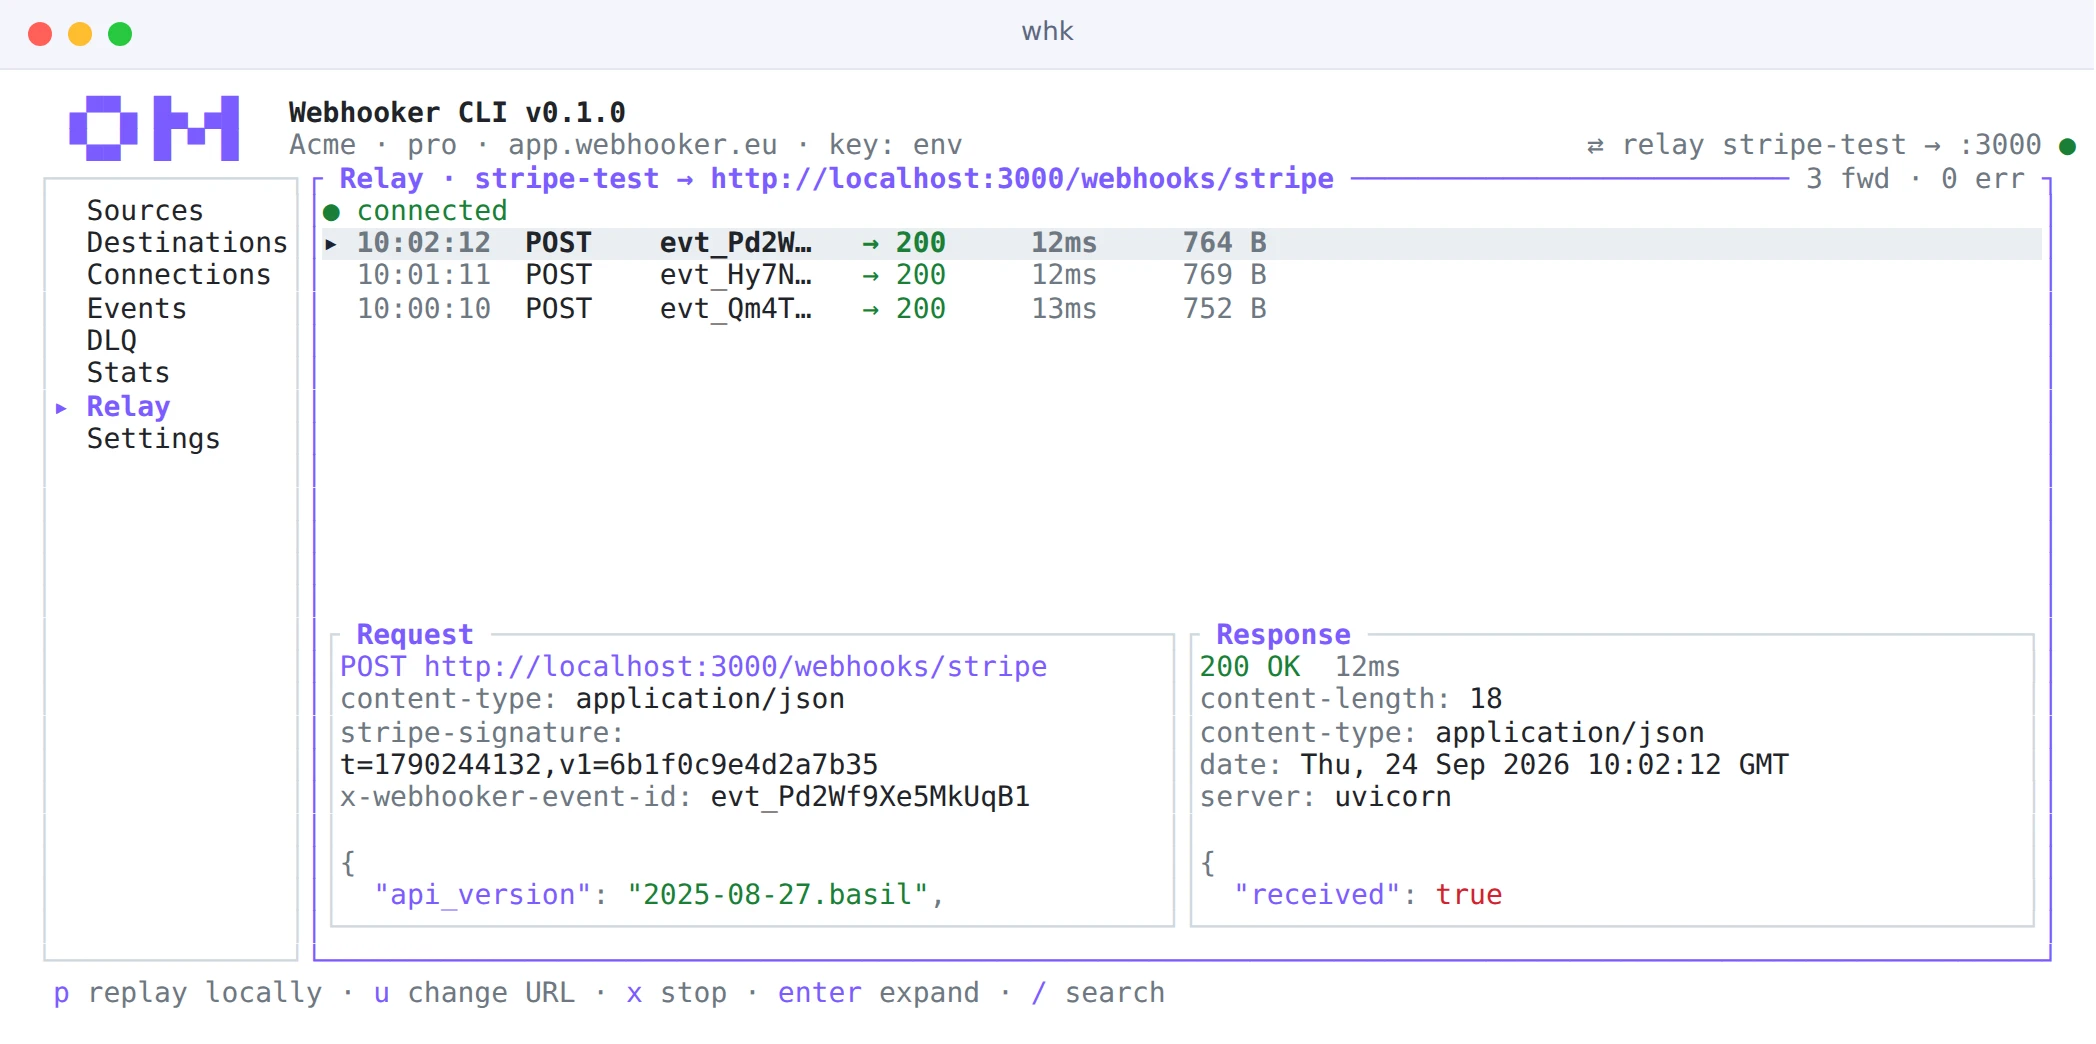
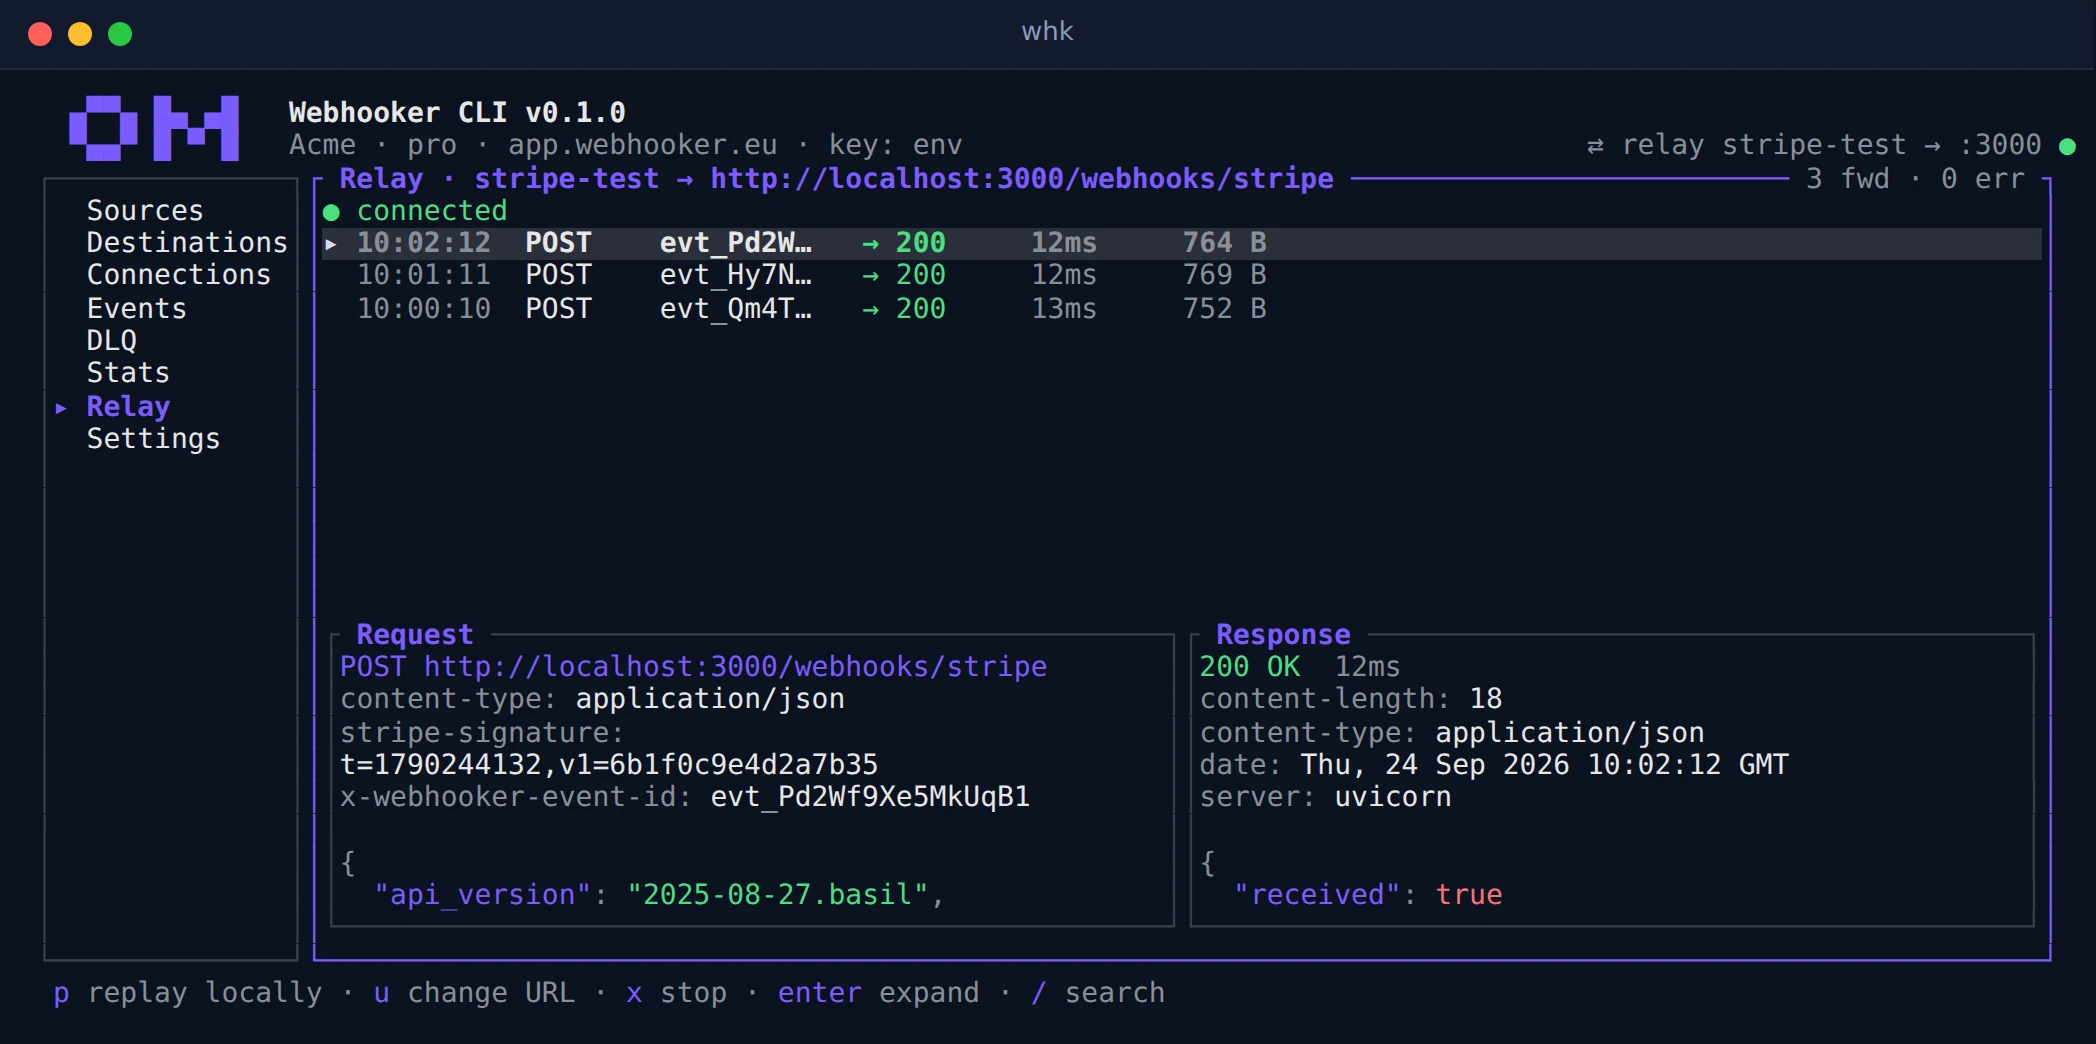
Each forwarded webhook gets a row with your handler’s status code, response time and size. Select a row to see the request that was sent and the response that came back. From there:
| Key | Action |
|---|---|
p | Send the selected webhook to your handler again |
u | Change the target URL without stopping the relay |
x | Stop the relay |
enter | Expand the request and response panes |
/ | Search the forwarded webhooks |
The relay keeps running while you move to other screens. The header shows its source, target port and connection state.
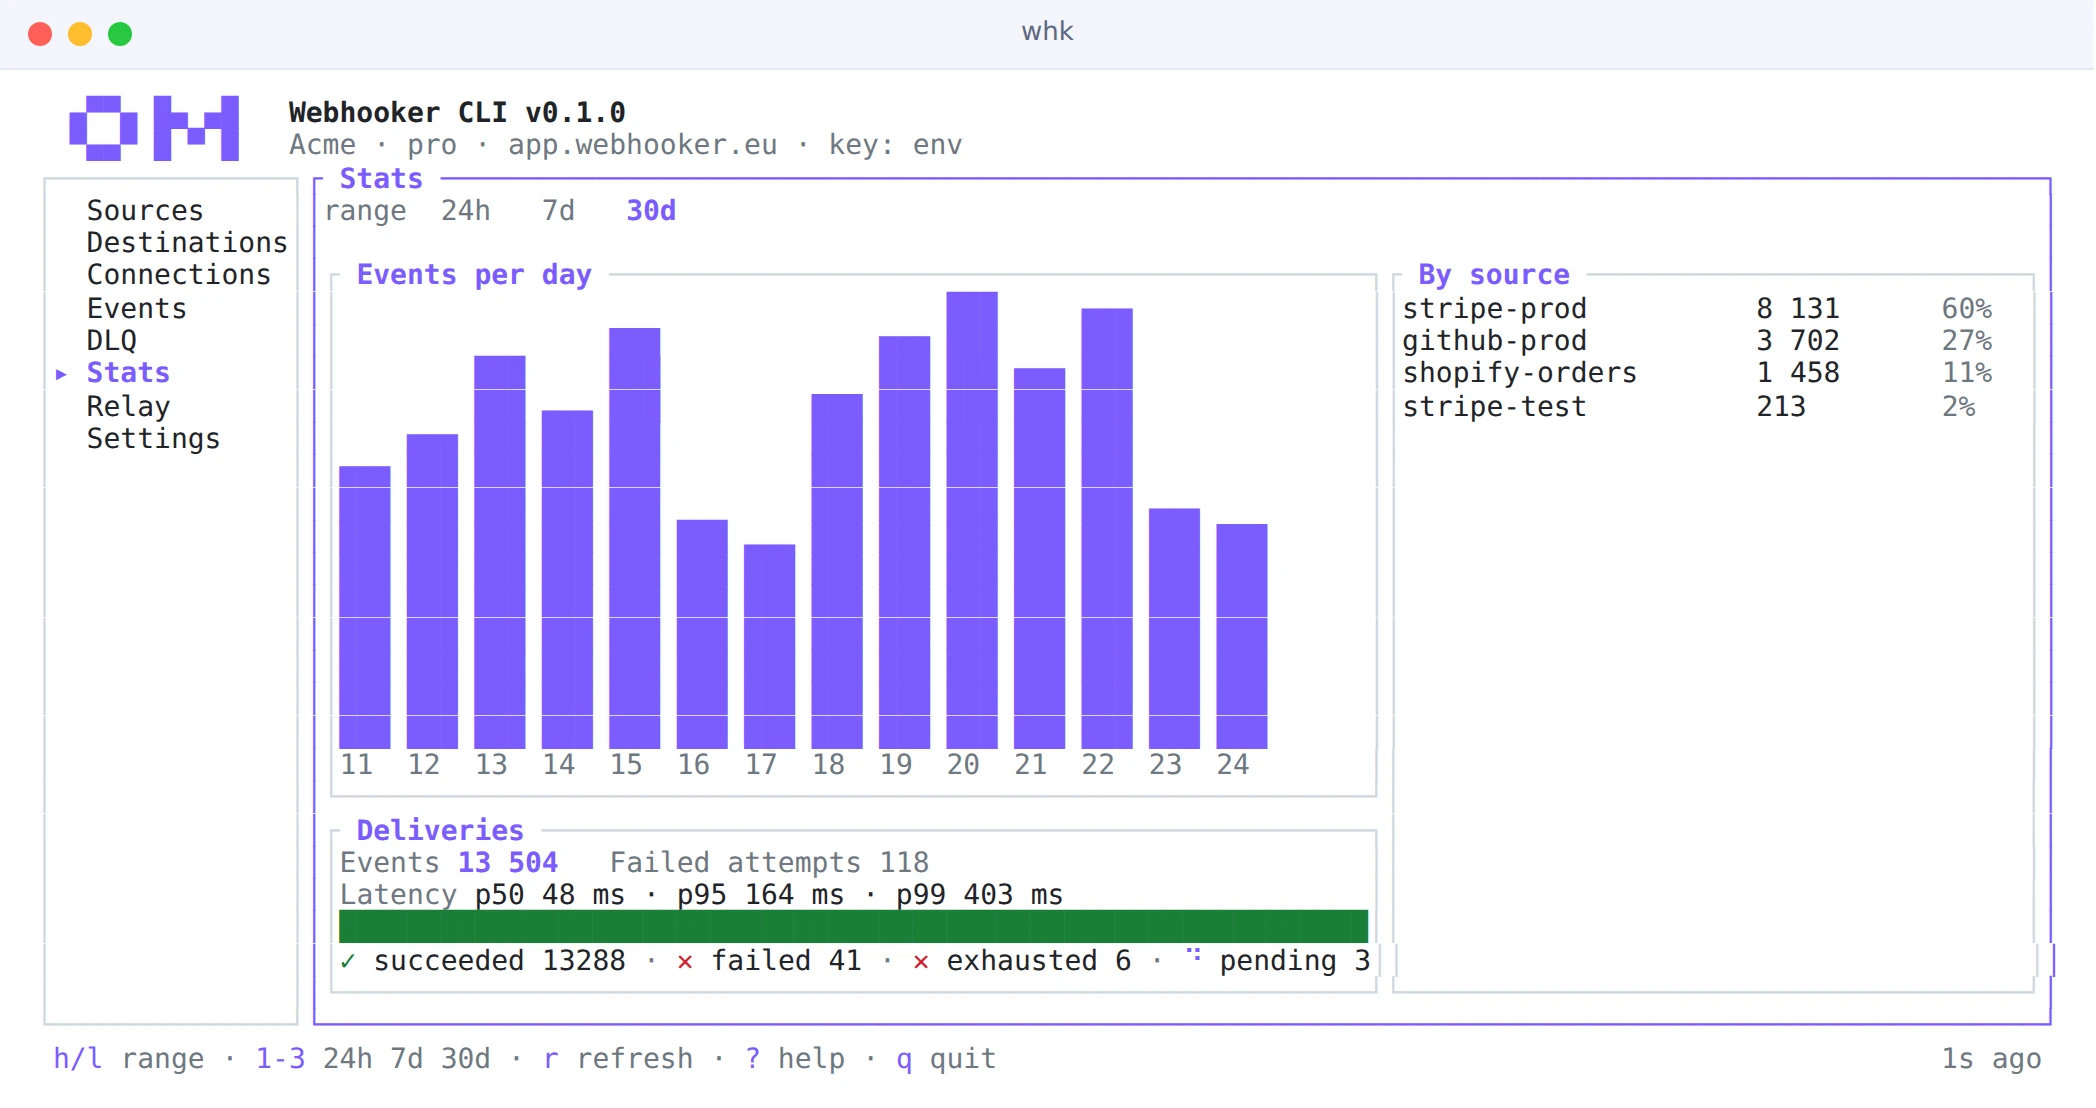
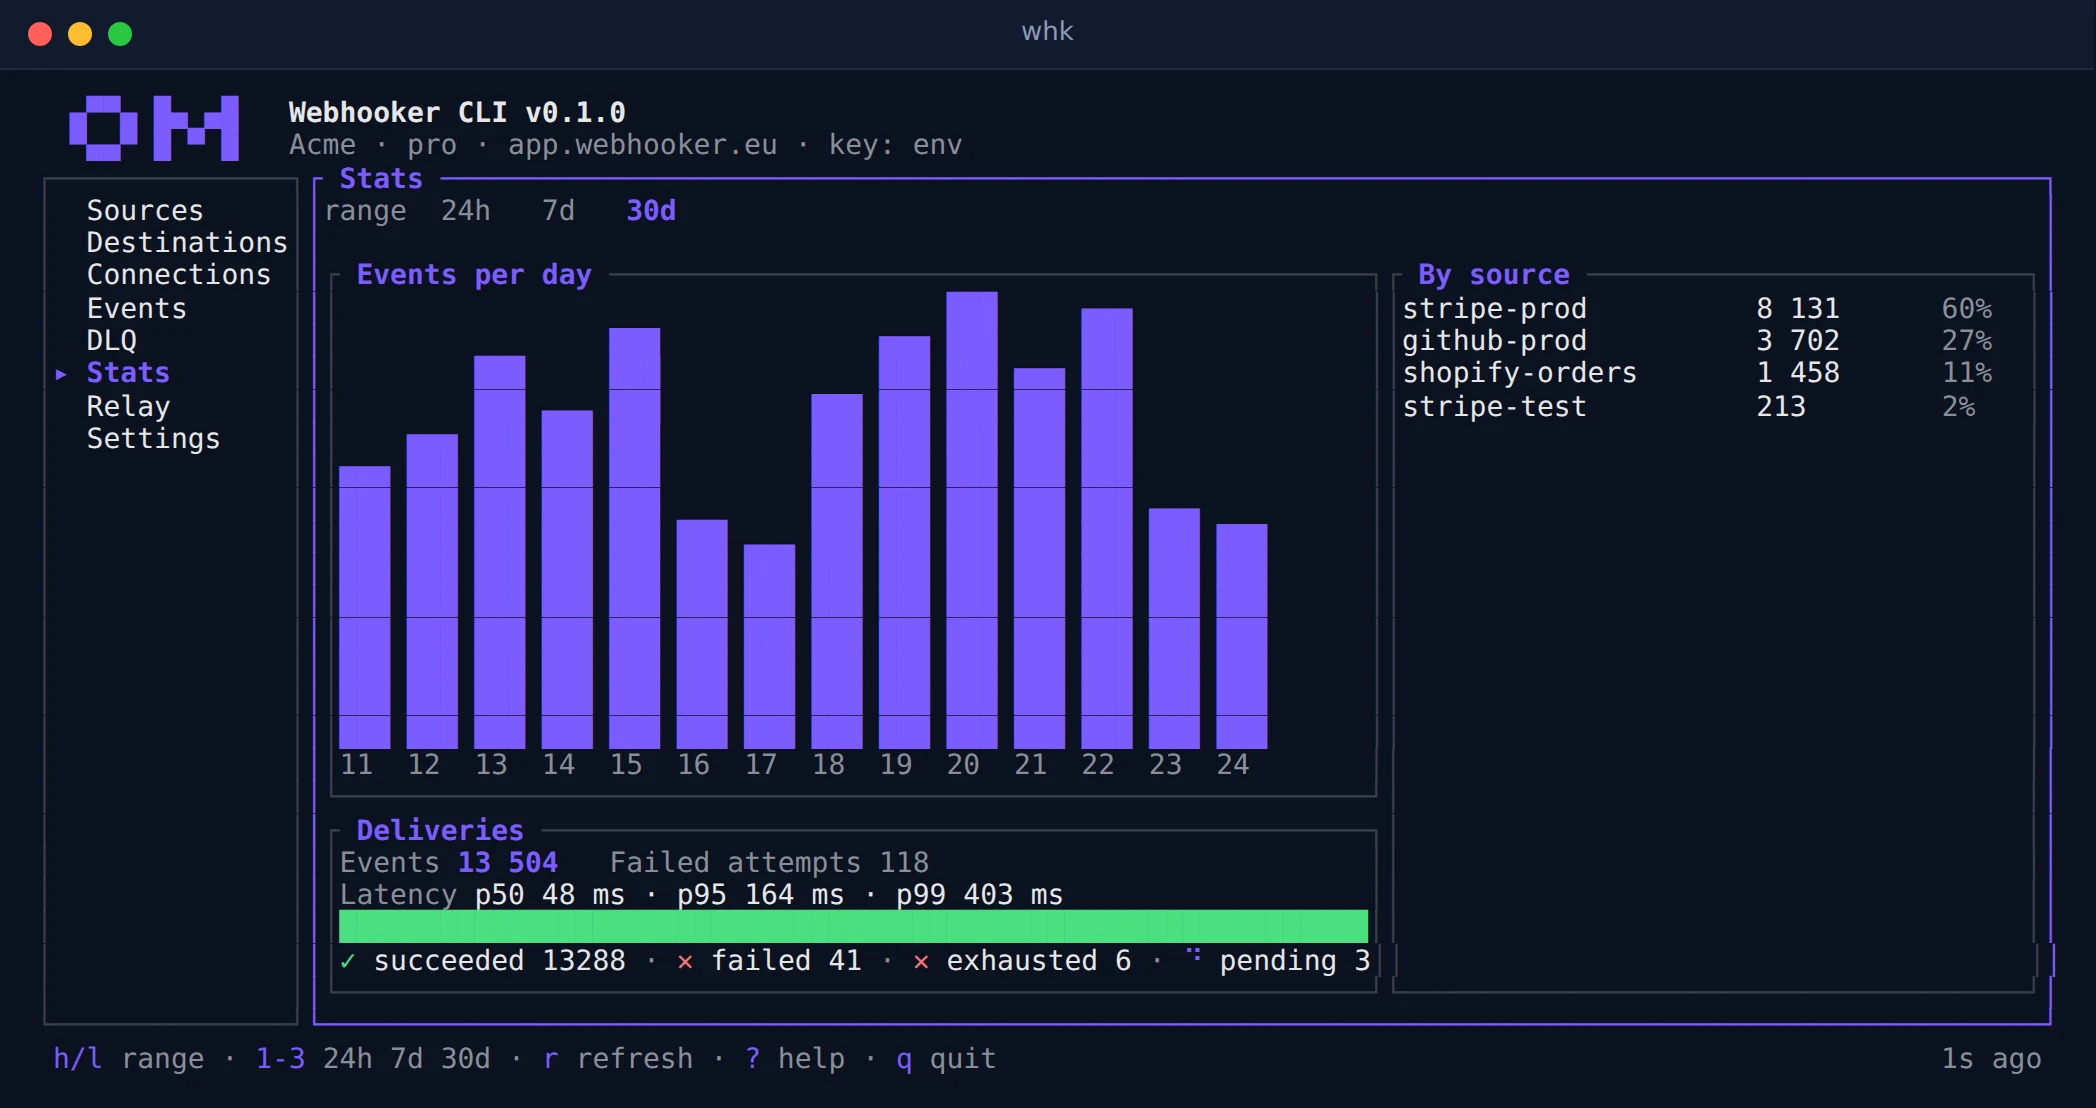
The stats screen charts events per day, splits volume by source and shows
delivery outcomes with p50, p95 and p99 latency. 1, 2 and 3 switch the
range between 24 hours, 7 days and 30 days.
Settings
Section titled “Settings”Press g then , to open the settings. They are saved in the [ui] table of
the same config.toml that holds your key.
| Setting | Values | What it changes |
|---|---|---|
Open on bare whk | on, off | Whether whk with no arguments opens the UI or prints help |
| Theme | auto, dark, light, high-contrast | The color palette |
| Accent color | hex | The highlight color |
| ASCII only | on, off | Replaces box-drawing characters and symbols with plain ASCII |
| Start screen | sources, events, relay, stats, last | The screen the UI opens on |
| Time format | local, utc, relative | How timestamps are shown |
| Request budget (%) | 10–90 | Share of your plan’s API rate limit the UI may spend on refreshes |
| Relay default URL | URL | Pre-filled target for new relays |
| Clipboard | osc52, off | Whether y copies through the terminal’s OSC 52 sequence |
| Compact header | on, off | Shrinks the header to one line without the logo |
The request budget exists because the UI shares the workspace’s rate limit with your scripts and CI. At the default of 50%, a busy dashboard can’t starve a deploy job of API calls.
Outside a terminal, for example in a pipe or with --json, a bare whk
prints help instead of opening the UI. WHK_NO_TUI=1 does the same
everywhere.
The UI picks a light or dark palette from the COLORFGBG variable your
terminal sets, and falls back to 256 colors when COLORTERM does not announce
truecolor. NO_COLOR=1 turns colors off and WHK_ASCII=1 forces ASCII
output, which helps on the Linux console and in old Windows terminals.